Environment Reporting BC
Categories:
Do you ever wonder just how healthy our environment in BC is? How clean is our air and water? How fast is our climate changing? And – perhaps – how much of our land and water is protected?
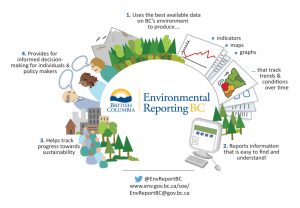
Environmental Reporting BC provides access to scientific data and information about the state of our environment and how it all relates to British Columbians. It develops and shares “indicators” – or standard measurements that can be used to show trends in environmental changes over time – of all kinds of aspects of the health of BC’s environment. They share data in a clear, understandable format that all British Columbians can access. The data they generate falls under the Open Government License — BC and is available in the BC Data Catalogue. The code they use to analyse the data is shared on Github—an online platform widely used to share and collaborate on code and other content. It is a transparent, neutral way for all British Columbians to see exactly how our environment is faring. They share their indicators on the Environmental Reporting B.C. website, and through their Twitter feed alongside lots of other related information about the state of B.C.’s environment.

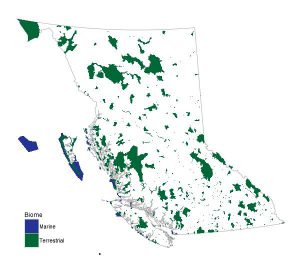
Their most recent indicator is called “Protected Lands and Waters in B.C.”. It looks at how much land and water has the highest level of protection in B.C., and how that has changed over time.
A few highlights:
- Protected lands and waters cover 15.4% of B.C.’s land and 3.2% of B.C.’s marine areas.
- BC Parks managed most of that – 14.4% of B.C.’s land and 0.9% of B.C.’s marine areas.
- The amount of protected land and water in B.C. has more than doubled since the early 1990’s.

Check out Environmental Reporting B.C. to find out more about BC Parks and other protected land and water in B.C., or to see more data about the state of B.C.’s environment.


